The last few weeks have seen a dramatic shift in expectations for the outcome of the US presidential election. Starting with a poor debate performance by Joe Biden, which catalysed calls for him to drop out of the race, followed by an assassination attempt on Donald Trump and more recently the unprecedented withdrawal of the sitting president from the election race.
Who will win the 2024 US Presidential Election?

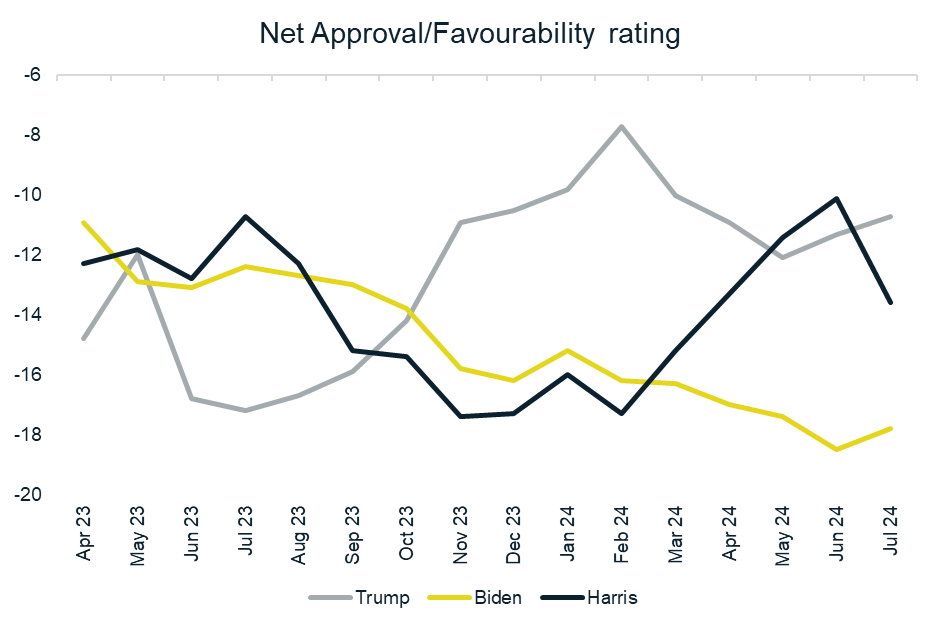
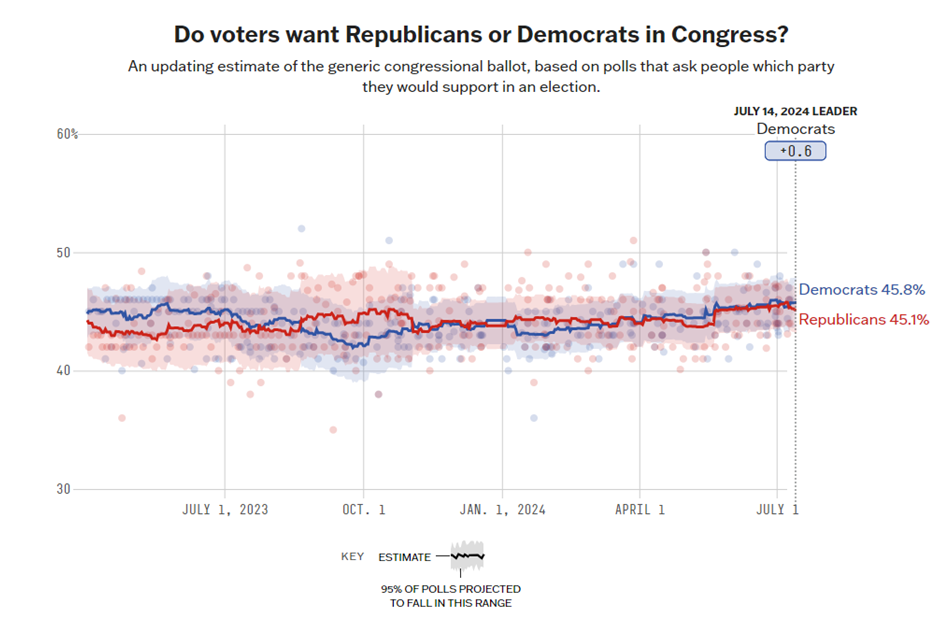
The chart above shows the net favourability/approval rating of each of Donald Trump, Jo Biden and Kamala Harris over time. Given the steady decline in Biden’s approval over the last year the market was beginning to price in a Trump victory, even though polling shows very little difference for support between the two parties.
Given that Harris is now polling with a better approval rating than Biden, her replacement of Biden as the democratic candidate may boost the Democrat’s chances in the presidential race.

So, what could a Trump re-election mean for global asset prices and SA Equities?
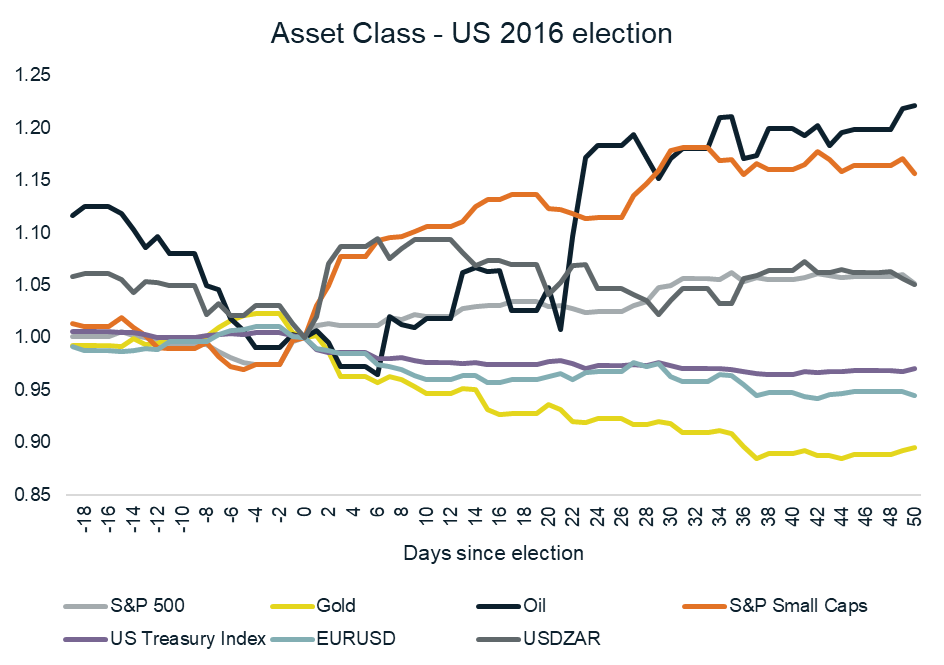
To get some insight into this, we chart the performance of various global asset classes below over the period of Trump’s election in 2016. Here, each asset is normalised to a value of 100 at the date of the election, and performance is shown from prior to the election to 50 trading days thereafter. Globally, the 2016 Trump election was seen as positive for risky assets and potentially inflationary. The dollar strengthened, stocks outperformed bonds, and small caps outperformed large caps. Gold also lagged.
The current Trump trade seems to be repeating some of these moves, as US small caps have recently shown strong outperformance over large caps. On the outlook for yields and rates, the US yield curve has steepened somewhat in the near term as market prices face potential pressure from Trump on the Fed to cut rates.

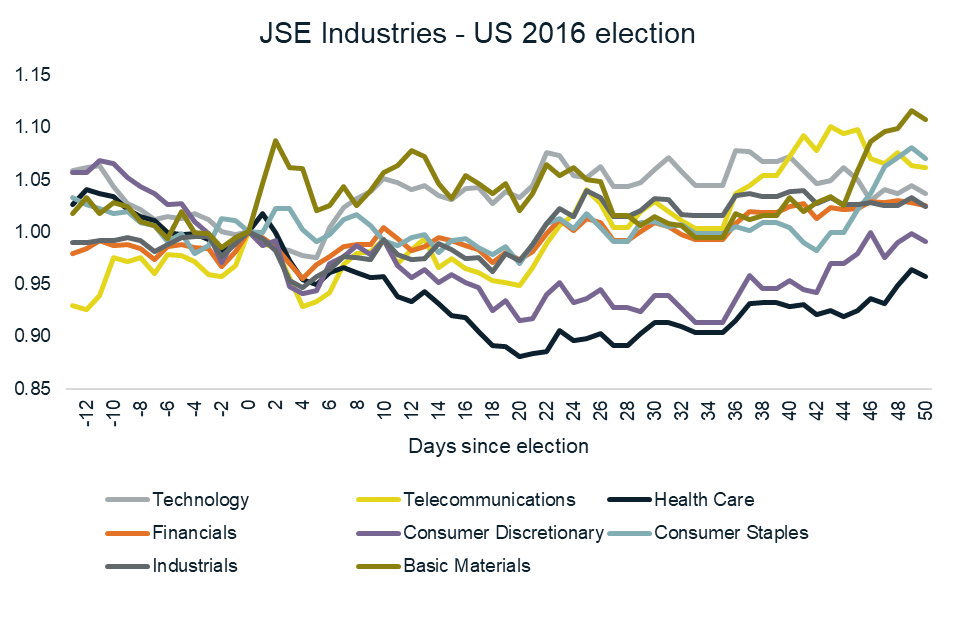
Looking at the performance of SA stocks, the initial reaction was mainly driven by Rand weakness in the face of a stronger dollar. Commodity stocks rallied as domestic sectors (healthcare, financials, and consumer discretionary) rallied. Over the 50 trading days following the election, basic material stocks performed the best, while healthcare lagged the most.

Importantly though, there are a number of differences between the current environment and 2016. Trade relations with China may be more in focus in 2024, than they were in 2016. While tensions between the Trump administration and China grew over his term in office, the market would go into his second term with a big focus on US China relations and the potential for a more inward-focused US policy.
Secondly, asset class valuations and the macro backdrop are changed. US stocks and credit are both more expensive now than they were in 2016, leaving less room for a positive rerating. Similarly, commodity prices and the valuations of basic materials shares were low in 2016, having come off a torrid few years of performance.
The reaction of this sector to a second Trump term may be different in 2024 on a different starting valuation basis.
Our Market Snippets aim to provide concise insight into our investment research process. Each week, we highlight one chart that showcases our research, motivates our current positioning, or simply presents something interesting we’ve discovered in global financial markets.
For more of our current market views, please visit our website.


