“In truth, the gold standard is already a barbarous relic.” -John Maynard Keynes, A Tract on Monetary Reform, 1923
“Gold … has two significant shortcomings, being neither of much use nor procreative.” – Warren Buffett, Berkshire Hathaway letter to shareholders, 2011
No investment evokes more passion in its supporters and detractors than gold (okay, possibly Bitcoin does). Goldd has been called everything from a barbarous relic and pet rock to the only true currency. Warren Buffett has been famously negative on gold as an investor, often citing its main drawback, that it generates no yield or growth.
But does an investment in physical gold offer investors, in particular South African multi asset investors, a portfolio construction benefit? At a simple first glance it may not be obvious. Physical gold has delivered a lower return at a higher volatility in Rands than domestic equities over the past 20 years. But this analysis does not take into account when it has delivered those returns, did gold generate positive returns during good or bad times for markets?
While the return that an asset generates relative to its volatility is an important consideration for investors, the correlation between the returns of that asset and the other assets in a portfolio is also important. This is particularly true when markets are falling. An asset that tends to generate positive returns when other assets are negative is particularly useful when building a portfolio.
Often, this diversification benefit is priced by the market and these assets tend to deliver lower long-term returns. This is the case when considering US Dollars and US Treasuries. Historically, these assets have delivered a lower risk and diversifying impact on a balanced portfolio, and hence investors are willing to accept a lower return from these assets.
This has not been the case over the past two decades for physical gold, particularly from the perspective of a Rand-based investor.
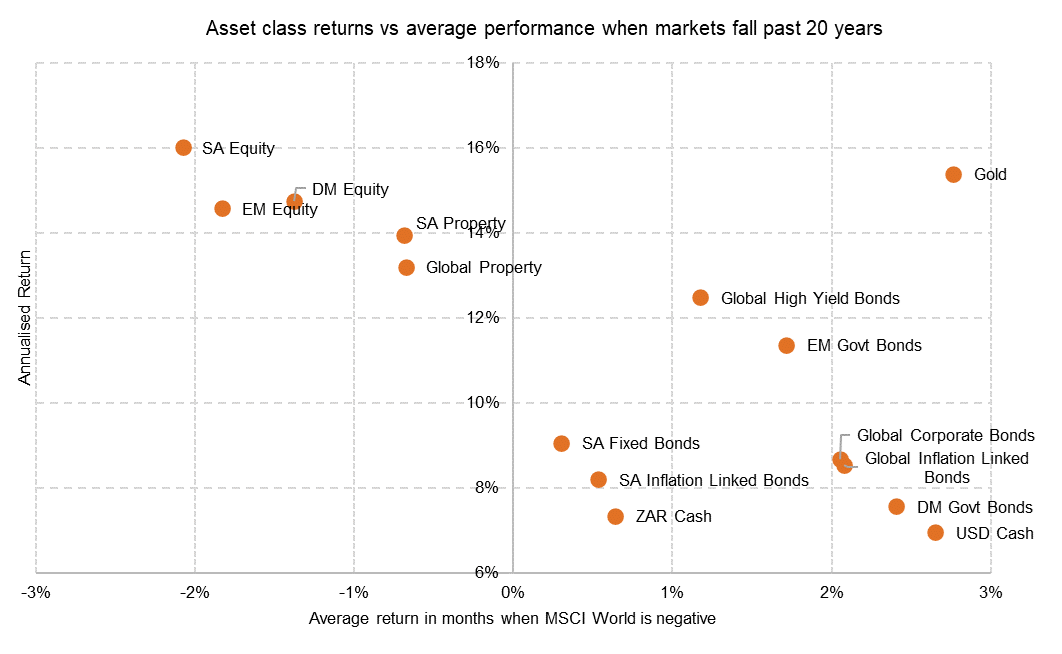
The chart below shows the average monthly return of various asset classes measured in Rands in months when global equity delivers negative returns. It also compares these monthly returns with the annualised returns that each asset has delivered over the past 20 years.

Source: Mergence calculations
Most assets tend to sit on a downward-sloping line in this chart. Assets to the left of the chart generate high returns through the cycle but tend to fall, when global equity falls and risk sentiment sours.
Assets to the right tend to outperform when equity falls but, are lower-risk and tend to generate a lower return over time. But over the past 20 years, physical gold has sat in the top right of this chart, providing a positive return to Rand-based investors when equity markets fall, but also a higher through-the-cycle return, similar to that delivered by equities.
It is for this reason that we hold a structural physical gold position in domestic multi-asset mandates. While it may not produce a yield or pay a dividend, gold has historically provided a hedge to falling equity markets and, at the same time, generated returns over the long term, and the diversification benefits improve the overall risk and return outcomes of our portfolios.
Our Market Snippets aim to provide concise insight into our investment research process. Each week, we highlight one chart that showcases our research, motivates our current positioning, or simply presents something interesting we’ve discovered in global financial markets.
For more of our current market views, please visit our website.


